CONSTRUCTION OF PIE CHART
Subscribe to our ▶️ YouTube channel 🔴 for the latest videos, updates, and tips.
Here, we take a circle and the whole circle is divided into sectors. The size of each sector is proportional to the activity or information it represents.
Because the sectors resemble the slices of a pie, it is called a pie chart.
Important Note
In a pie chart, the various observations or components are represented by the sectors of a circle and the whole circle represents the sum of the value of all the components .Clearly, the total angle of 360° at the center of the circle is divided according to the values of the components .
The central angle of a component is
= [Value of the component / Total value] ⋅ 360°
Sometimes, the value of the components are expressed in percentages. In such cases,
The central angle of a component is
= [Percentage value of the component / 100] ⋅ 360°
Steps to Construct a Pie-Chart
Step 1 :
Calculate the central angle for each component , using the above formula.
Step 2 :
Draw a circle of convenient radius.
Step 3 :
Within this circle, draw a horizontal radius.
Step 4 :
Draw radius making central angle of first component with horizontal radius; this sector represents the first component. From this radius, draw next radius with central angle of second component; this sector represents second component and so on, until we exhaust all components.
Step 5 :
Shade each sector differently and mark the component it represents.
Step 6 :
Give the heading for each component.
Examples
Example 1 :
The number of hours spent by a school student on various activities on a working day, is given below. Construct a pie chart using the angle measurement.
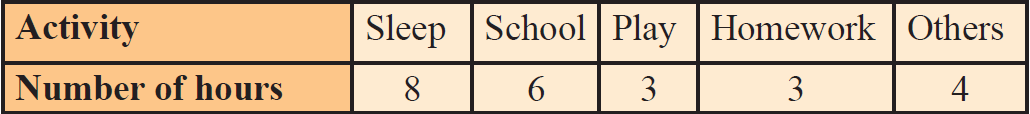
Draw a pie chart to represent the above information.
Solution :
The central angle of a component is
= [Value of the component / 100] ⋅ 360°
We may calculate the central angles for various components as follows :
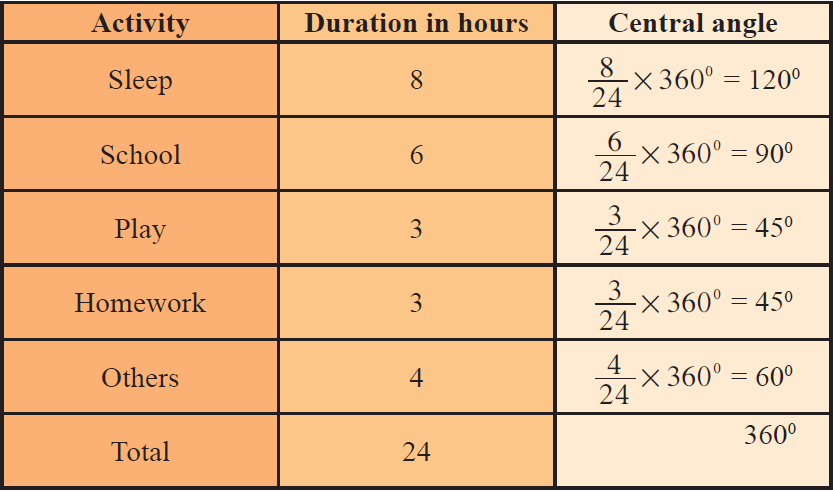
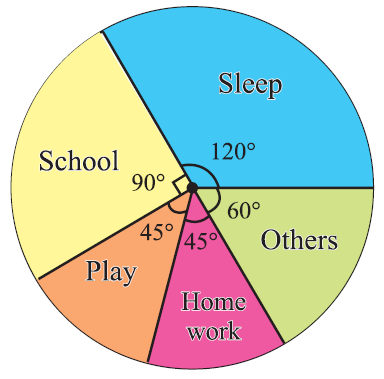
From the above table, clearly, we obtain the required pie chart as shown below.
Example 2 :
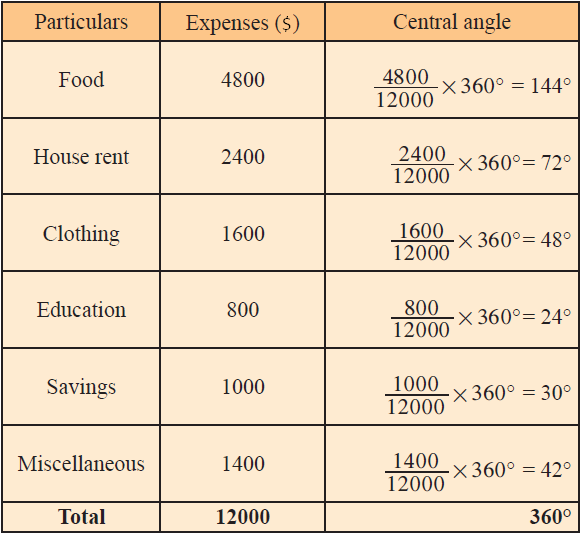
The following table shows the half yearly budget of a family
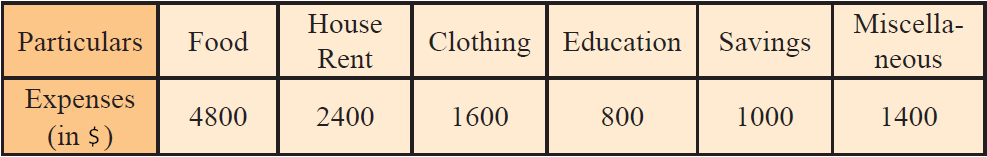
Draw a pie chart to represent the above information.
Solution :
The central angle of a component is
= [Value of the component / 100] ⋅ 360°
We may calculate the central angles for various components as follows :
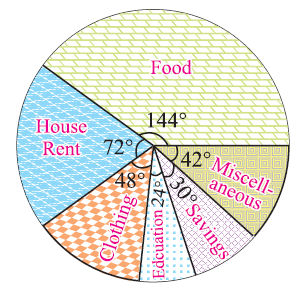
From the above table, clearly, we obtain the required pie chart as shown below.
Example 3 :
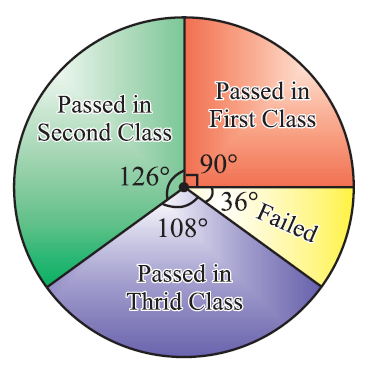
The result of an examination of a school is as follows :
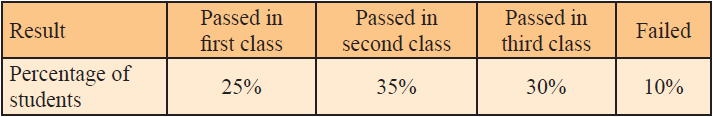
Draw a pie chart to represent the above information.
Solution :
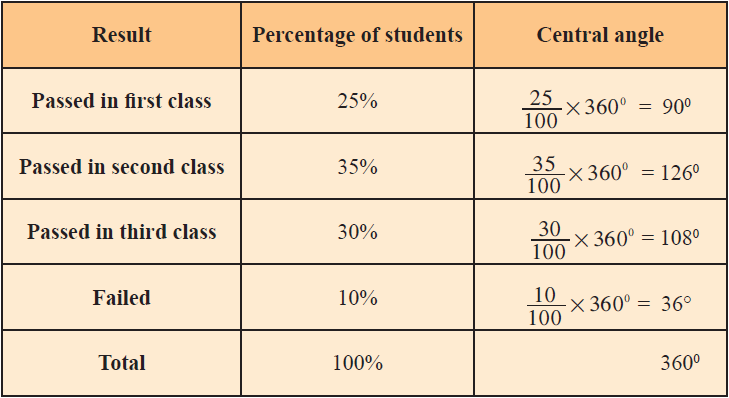
The central angle of a component is
= [Value of the component / 100] ⋅ 360°
We may calculate the central angles for various components as follows :
From the above table, clearly, we obtain the required pie chart as shown below.
Subscribe to our ▶️ YouTube channel 🔴 for the latest videos, updates, and tips.
Kindly mail your feedback to v4formath@gmail.com
We always appreciate your feedback.
About Us | Contact Us | Privacy Policy
©All rights reserved. onlinemath4all.com

Recent Articles
-
Digital SAT Math Questions and Answers (Part - 13)
May 10, 26 05:50 PM
 Digital SAT Math Questions and Answers (Part - 13)
 -
Problems on Solving Logarithmic Equations
Apr 24, 26 09:30 PM
Problems on Solving Logarithmic Equations -
Solving Logarithmic Equations Worksheet
Apr 24, 26 09:05 PM
 Solving Logarithmic Equations Worksheet