COMPARING BOX PLOTS
Subscribe to our ▶️ YouTube channel 🔴 for the latest videos, updates, and tips.
We can compare two box plots numerically according to their centers, or medians, and their spreads, or variability. Range and interquartile range (IQR) are both measures of spread.
Box plots with similar variability should have similar boxes and whiskers.
Box plots with greater variability, where there is less overlap of the median and interquartile range.
Box Plots with Similar Variability
The box plots show the distribution of times spent shopping by two different groups.

1. Compare the shapes of the box plots.
The positions and lengths of the boxes and whiskers appear to be very similar. In both plots, the right whisker is shorter than the left whisker.
2. Compare the centers of the box plots.
Group A’s median, 47.5, is greater than Group B’s, 40. This means that the median shopping time for Group A is 7.5 minutes more.
3. Compare the spreads of the box plots.
The box shows the interquartile range. The boxes are similar.
Group A: 55 - 30 = 25 min Group B: About 59 - 32 = 27 min
The whiskers have similar lengths, with Group A’s slightly shorter than Group B’s.
4. Which group has the greater variability in the bottom 50% of shopping times ? The top 50% of shopping times ? Explain how you know.
Group A; Group B; look at which box plot has a greater distance from the median to the minimum or maximum value, respectively.
Box plots with different variability
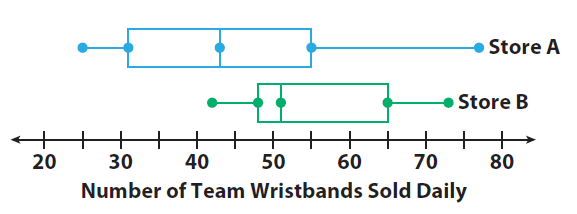
The box plots show the distribution of the number of team wristbands sold daily by two different stores over the same time period.
1. Compare the shapes of the box plots.
Store A’s box and right whisker are longer than Store B’s.
2. Compare the centers of the box plots.
Store A’s median is about 43, and Store B’s is about 51. Store A’s median is close to Store B’s minimum value, so about 50% of Store A’s daily sales were less than sales on Store B’s worst day.
3. Compare the spreads of the box plots.
Store A has a greater spread. Its range and inter quartile range are both greater.
Four of Store B’s key values are greater than Store A’s corresponding value.
Store B had a greater number of sales overall.
Subscribe to our ▶️ YouTube channel 🔴 for the latest videos, updates, and tips.
Kindly mail your feedback to v4formath@gmail.com
We always appreciate your feedback.
About Us | Contact Us | Privacy Policy
©All rights reserved. onlinemath4all.com

Recent Articles
-
AP Calculus AB Problems with Solutions (Part - 1)
May 29, 26 09:41 PM
 AP Calculus AB Problems with Solutions (Part - 1)
 -
SAT Math Practice Problems with Answers
May 21, 26 01:17 AM
 SAT Math Practice Problems with Answers
 -
Digital SAT Math Questions and Answers (Part - 13)
May 17, 26 09:03 AM
 Digital SAT Math Questions and Answers (Part - 13)