BOX PLOTS
Subscribe to our ▶️ YouTube channel 🔴 for the latest videos, updates, and tips.
A box plot is a display that shows how the values in a data set are distributed, or spread out. To make a box-plot, first find five values for the data set :
- the least value
- the lower quartile — the median of the lower half of the data
- the median
- the upper quartile — the median of the upper half of the data
- the greatest value
The picture given below clearly illustrates a box-plot.

In the above figure, the box spans interquartile range (central 50%).
To draw box-plot graph for a data set, we have to know lower quartile, upper quartile and median.
Steps to Construct Box and Whisker Plot
To construct box-plot for the given data set, we have to do the following steps.
Step 1 :
Write the observations of the given data set in ascending order.
Step 2 :
Find lower quartile, upper quartile and median using the formulas given below.
Lower Quartile = [⁽ⁿ ⁺ ¹⁾⁄₄]th value
Upper Quartile = [³⁽ⁿ ⁺ ¹⁾⁄₄]th value
Median = [⁽ⁿ ⁺ ¹⁾⁄₂]th value
Here, n = number of observations in the given data set.
Step 3 :
Using lower quartile, upper quartile and median, we have to construct box-plot as given in the above picture.
Example 1 :
Make a box-plot for the data given below.
4.3, 5.1, 3.9, 4.5, 4.4, 4.9, 5.0, 4.7, 4.1, 4.6, 4.4, 4.3, 4.8, 4.4, 4.2, 4.5, 4.4
Solution :
Making box plot :
Step 1 :
Let us write the observations in the data in ascending order.
3.9, 4.1, 4.2, 4.3, 4.3, 4.4, 4.4, 4.4, 4.4, 4.5, 4.5, 4.6, 4.7, 4.8, 4.9, 5.0, 5.1
Step 2 :
Number of observations (n) = 17.
Let us find lower quartile, upper quartile and median.
Lower Quartile :
To find the lower quartile, find the value of ⁽ⁿ ⁺ ¹⁾⁄₄.
= ⁽ⁿ ⁺ ¹⁾⁄₄
= ⁽¹⁷ ⁺ ¹⁾⁄₄
= ¹⁸⁄₄
= 4.5
Lower quartile comes in between 4th and 5th observations.
So, lower quartile is equal to average of 4th and 5th observations.
Lower quartile :
= ⁽⁴.³ ⁺ ⁴.³⁾⁄₂
= ⁸.⁶⁄₂
= 4.3
Upper Quartile :
To find the upper quartile, find the value of ³⁽ⁿ ⁺ ¹⁾⁄₄.
= ³⁽ⁿ ⁺ ¹⁾⁄₄
= ³⁽¹⁷ ⁺ ¹⁾⁄₄
= ⁵⁴⁄₄
= 13.5
Upper quartile comes in between 13th and 14th observations.
So, upper quartile is equal to average of 13th and 14th observations.
Upper quartile :
= ⁽⁴.⁷ ⁺ ⁴.⁸⁾⁄₂
= ⁹.⁵⁄₂
= 4.75
Median :
To find the upper quartile, find the value of ⁽ⁿ ⁺ ¹⁾⁄₂.
= ⁽ⁿ ⁺ ¹⁾⁄₂
= ⁽¹⁷ ⁺ ¹⁾⁄₂
= ¹⁸⁄₂
= 9
Median is exactly the 9th observation.
So, median = 4.4.
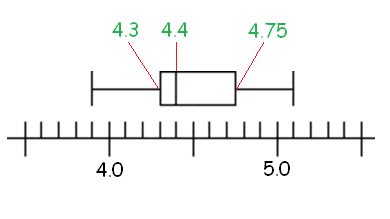
Step 3 :
Using lower quartile, upper quartile and median, we can make box-plot graph as given below.
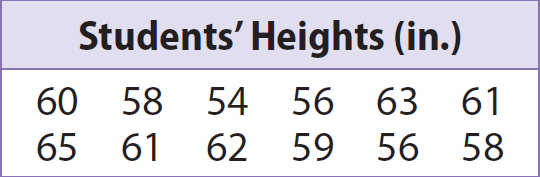
Example 2 :
The heights of several students are shown.
Make a box-plot for the data.
Solution :
Making box-plot :
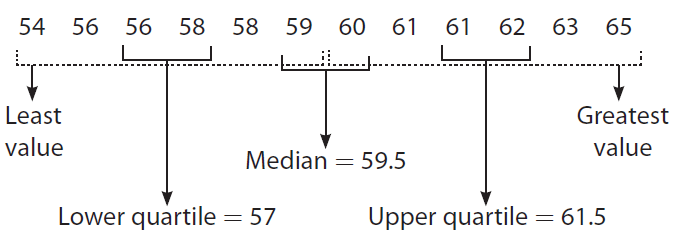
Step 1 :
Order the data and find the needed values.
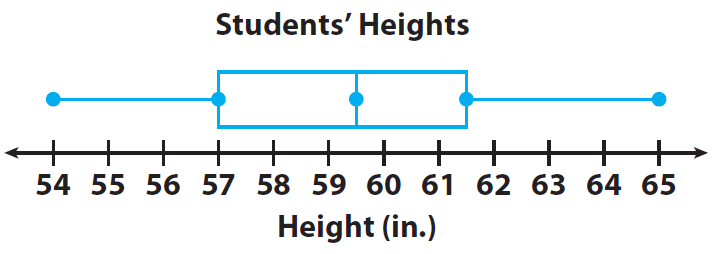
Step 2 :
Draw the box-plot.
Draw a number line that includes all the data values.
On the number line, draw dots above the least value, the lower quartile, the median, the upper quartile, and the greatest value.
Reflect
In the example, what percent of the data values are included in the box portion ? What percent are included in each of the “whiskers” on the ends of the box ?
50%, 25%, 25%
Subscribe to our ▶️ YouTube channel 🔴 for the latest videos, updates, and tips.
Kindly mail your feedback to v4formath@gmail.com
We always appreciate your feedback.
About Us | Contact Us | Privacy Policy
©All rights reserved. onlinemath4all.com

Recent Articles
-
SAT Math Practice Problems with Answers
May 21, 26 01:17 AM
 SAT Math Practice Problems with Answers
 -
Digital SAT Math Questions and Answers (Part - 13)
May 17, 26 09:03 AM
 Digital SAT Math Questions and Answers (Part - 13)
 -
Problems on Solving Logarithmic Equations
Apr 24, 26 09:30 PM
Problems on Solving Logarithmic Equations

