BOX AND WHISKER PLOT
Subscribe to our ▶️ YouTube channel 🔴 for the latest videos, updates, and tips.
Box and whisker-plot is the graph used in statistics to represent the central 50% of the values of a data set.
The picture figure given below clearly illustrates this.

In the above figure, the box spans interquartile range (central 50%).
To draw box and whisker-plot graph for a data set, we have to know lower quartile, upper quartile and median.
Steps to Construct Box and Whisker Plot
To construct box and whisker-plot for the given data set, we have to do the following steps.
Step 1 :
Write the observations of the given data set in ascending order.
Step 2 :
Find lower quartile, upper quartile and median using the formulas given below.
Lower quartile = (n + 1)/4
Upper quartile = 3(n + 1)/4
Median = (n + 1)/2
Here, n = number of observations in the given data set.
Step 3 :
Using lower quartile, upper quartile and median, we have to construct box and whisker-plot as given in the above picture.
Example
Construct box and whisker-plot for the data given below.
4.3, 5.1, 3.9, 4.5, 4.4, 4.9, 5.0, 4.7, 4.1, 4.6, 4.4, 4.3, 4.8, 4.4, 4.2, 4.5, 4.4
Construction of box and whisker-plot :
Step 1 :
Let us write the observations in the data in ascending order.
3.9, 4.1, 4.2, 4.3, 4.3, 4.4, 4.4, 4.4, 4.4, 4.5, 4.5, 4.6, 4.7, 4.8, 4.9, 5.0, 5.1
Step 2 :
Number of observations (n) = 17
Let us find lower quartile, upper quartile and median.
Lower Quartile :
Lower quartile = (n + 1)/4 = (17 + 1)/4 = 18/4 = 4.5
Lower quartile comes in between 4th and 5th observations.
So, lower quartile = average of 4th and 5th observations
Lower quartile = (4.3 + 4.3)/2 = 8.6/2 = 4.3
Upper Quartile :
Upper quartile = 3(n+1)/4 = 3(17 + 1)/4 = 54/4 = 13.5
Upper quartile comes in between 13th and 14th observations.
So, upper quartile = average of 13th and 14th observations
Upper quartile = (4.7 + 4.8)/2 = 9.5/2 = 4.75
Median :
Median = (n + 1)/2 = (17 + 1)/2 = 18/2 = 9
Median is exactly the 9th observation.
So, median = 4.4
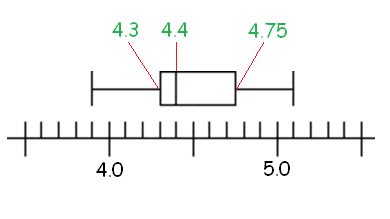
Step 3 :
Using lower quartile, upper quartile and median, we can construct box and whisker-plot graph as shown below.
Subscribe to our ▶️ YouTube channel 🔴 for the latest videos, updates, and tips.
Kindly mail your feedback to v4formath@gmail.com
We always appreciate your feedback.
About Us | Contact Us | Privacy Policy
©All rights reserved. onlinemath4all.com

Recent Articles
-
Digital SAT Math Questions and Answers (Part - 13)
May 10, 26 05:50 PM
 Digital SAT Math Questions and Answers (Part - 13)
 -
Problems on Solving Logarithmic Equations
Apr 24, 26 09:30 PM
Problems on Solving Logarithmic Equations -
Solving Logarithmic Equations Worksheet
Apr 24, 26 09:05 PM
 Solving Logarithmic Equations Worksheet