ANALYZING BOX PLOTS WORKSHEET
Subscribe to our ▶️ YouTube channel 🔴 for the latest videos, updates, and tips.
Problem 1 :
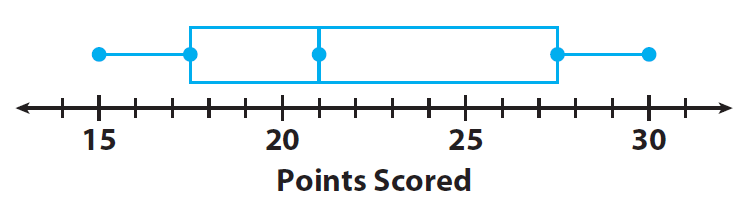
The number of points a high school basketball player scored during the games he played this season are organized in the box plot shown.
Questions :
1. Find the least and greatest values.
2. Find the median and describe what it means for the data.
3. Find and describe the lower and upper quartiles.
4. The inter quartile range is the difference between the upper and lower quartiles, which is represented by the length of the box. Find the interquartile range.
5. Why is one-half of the box wider than the other half of the box ?
Problem 2 :
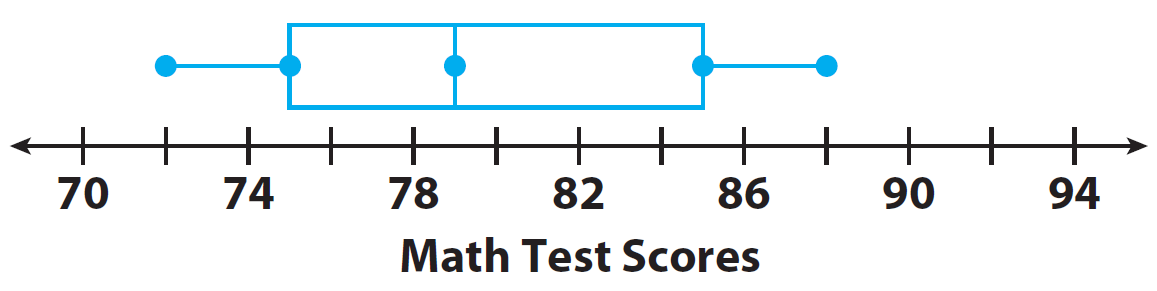
Maths test scores of a student in several tests are organized in the box plot shown.
Questions :
1. Find the minimum and maximum scores.
2. Find the range.
3. Find the median and describe what it means for the data.
4. Find and describe the lower and upper quartiles.
5. The inter quartile range is the difference between the upper and lower quartiles, which is represented by the length of the box. Find the interquartile range.

Detailed Answer Key
Problem 1 :
The number of points a high school basketball player scored during the games he played this season are organized in the box plot shown.
Answers :
1. Find the least and greatest values.
Least value : 15 points ;
Greatest value : 30 points
2. Find the median and describe what it means for the data.
Median : 21 points; the median, or second quartile,
Q2, divides the data values into two halves, a lower half and an upper half.
3. Find and describe the lower and upper quartiles.
The lower quartile, Q1, is the median of the lower half. The upper quartile, Q3, is the median of the upper half. Q1 : 17.5 and Q3 : 27.5
4. The inter quartile range is the difference between the upper and lower quartiles, which is represented by the length of the box. Find the interquartile range.
Q3 - Q1 = 27.5 - 17.5
Q3 - Q1 = 10 points.
5. Why is one-half of the box wider than the other half of the box ?
The quarter of data to the right of the median is more spread out than the quarter of data to the left of the median.
Problem 2 :
Maths test scores of a student in several tests are organized in the box plot shown.
Answers :
1. Find the minimum and maximum scores.
Minimum score : 72 ;
Maximum score : 88
2. Find the range.
Range = 88 - 72
Range = 16
3. Find the median and describe what it means for the data.
Median : 79 ; the median, or second quartile,
Q2, divides the data values into two halves, a lower half and an upper half.
4. Find and describe the lower and upper quartiles.
The lower quartile, Q1, is the median of the lower half. The upper quartile, Q3, is the median of the upper half. Q1 : 75 and Q3 : 85
5. The inter quartile range is the difference between the upper and lower quartiles, which is represented by the length of the box. Find the interquartile range.
Q3 - Q1 = 85 - 75
Q3 - Q1 = 10
Subscribe to our ▶️ YouTube channel 🔴 for the latest videos, updates, and tips.
Kindly mail your feedback to v4formath@gmail.com
We always appreciate your feedback.
About Us | Contact Us | Privacy Policy
©All rights reserved. onlinemath4all.com

Recent Articles
-
Digital SAT Math Questions and Answers (Part - 13)
May 10, 26 05:50 PM
 Digital SAT Math Questions and Answers (Part - 13)
 -
Problems on Solving Logarithmic Equations
Apr 24, 26 09:30 PM
Problems on Solving Logarithmic Equations -
Solving Logarithmic Equations Worksheet
Apr 24, 26 09:05 PM
 Solving Logarithmic Equations Worksheet

