ANALYZING AND COMPARING DATA
Subscribe to our ▶️ YouTube channel 🔴 for the latest videos, updates, and tips.
To understand two data sets more clearly, always it is important to analyse and compare them. We can do analyzing and comparing data sets using dot pots and box pots.
Analyzing Data Using Dot Plot
People once used body parts for measurements. For example, an inch was the width of a man’s thumb. In the 12th century, King Henry I of England stated that a yard was the distance from his nose to his outstretched arm’s thumb. The dot plot shows the different lengths, in inches, of the “yards” for students in a 7th grade class.
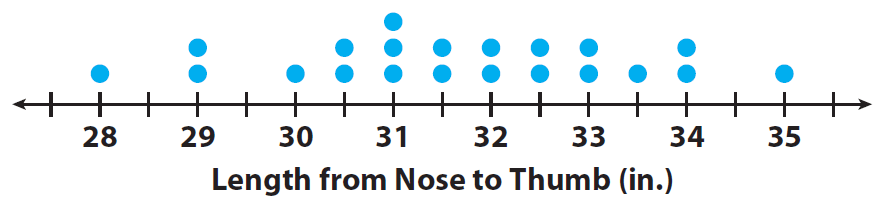
1. Describe the shape of the dot plot. Are the dots evenly distributed or grouped on one side ?
The dots are fairly evenly spread out with most in the middle.
2. Describe the center of the dot plot. What single dot would best represent the data ?
The dots are fairly evenly spread out with most in the middle.
3. Describe the spread of the dot plot. Are there any outliers ?
The data values start at 28 in. and end at 35 in. Most of the data is between 29 in. and 34 in. 28 and 35 do not look like outliers.
4. Calculate the mean, median, and range of the data in the dot plot.
Mean: about 31.6 in.; median: 31.5 in.; range: 7 in.
Analyzing Data Using Box Plot
The number of points a high school basketball player scored during the games he played this season are organized in the box plot shown.
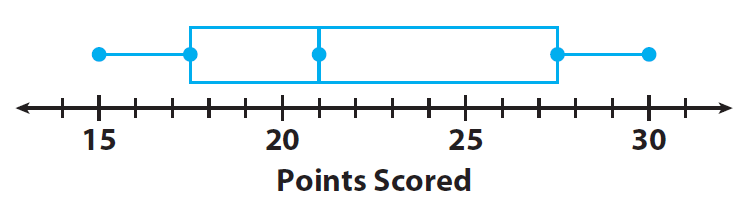
1. Find the least and greatest values.
Least value : 15 points ;
Greatest value : 30 points
2. Find the median and describe what it means for the data.
Median : 21 points; the median, or second quartile,
Q2, divides the data values into two halves, a lower half and an upper half.
3. Find and describe the lower and upper quartiles.
The lower quartile, Q1, is the median of the lower half. The upper quartile, Q3, is the median of the upper half. Q1 : 17.5 and Q3 : 27.5
4. The inter quartile range is the difference between the upper and lower quartiles, which is represented by the length of the box. Find the interquartile range.
Q3 - Q1 = 27.5 - 17.5
Q3 - Q1 = 10 points.
5. Why is one-half of the box wider than the other half of the box ?
The quarter of data to the right of the median is more spread out than the quarter of data to the left of the median.
Comparing Data Using Dot Plot
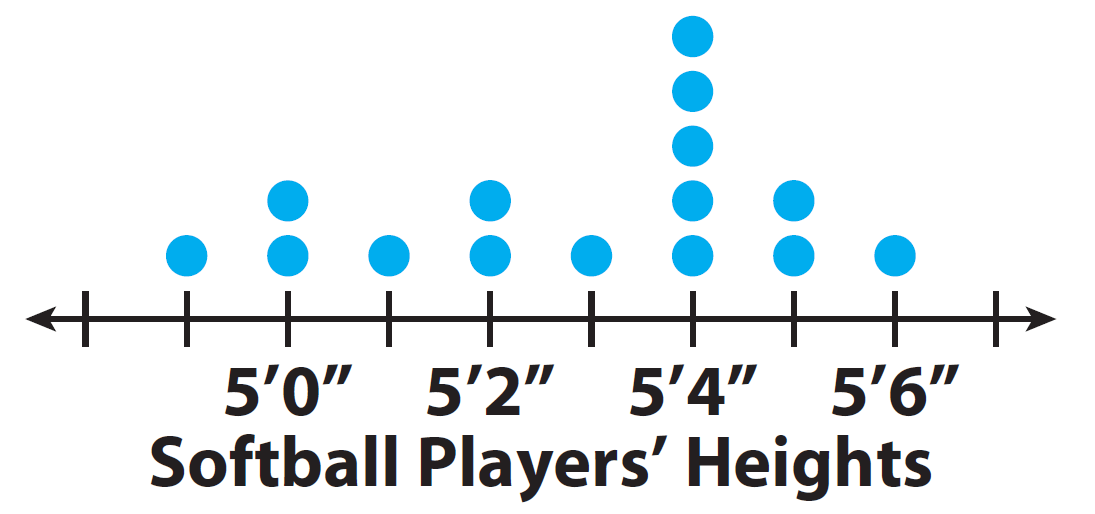
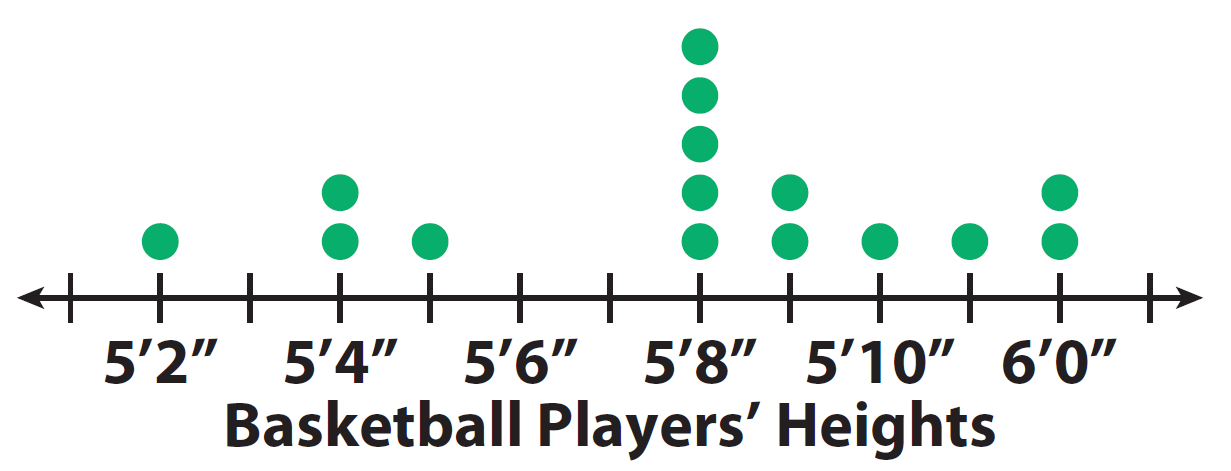
The dot plots show the heights of 15 high school basketball players and the heights of 15 high school softball players.
1. Visually compare the shapes of the dot plots.
Softball : All the data is 5’6” or less.
Basketball : Most of the data is 5’8” or greater.
As a group, the softball players are shorter than the basketball players.
2. Visually compare the centers of the dot plots.
Softball : The data is centered around 5’4”.
Basketball : The data is centered around 5’8”.
This means that the most common height for the softball players is 5 feet 4 inches, and for the basketball players 5 feet 8 inches.
3. Visually compare the spreads of the dot plots.
Softball : The spread is from 4’11” to 5’6”.
Basketball : The spread is from 5’2” to 6’0”.
There is a greater spread in heights for the basketball players.
Comparing Data Using Box Plot
The box plots show the distribution of times spent shopping by two different groups.

1. Compare the shapes of the box plots.
The positions and lengths of the boxes and whiskers appear to be very similar. In both plots, the right whisker is shorter than the left whisker.
2. Compare the centers of the box plots.
Group A’s median, 47.5, is greater than Group B’s, 40. This means that the median shopping time for Group A is 7.5 minutes more.
3. Compare the spreads of the box plots.
The box shows the interquartile range. The boxes are similar.
Group A: 55 - 30 = 25 min Group B: About 59 - 32 = 27 min
The whiskers have similar lengths, with Group A’s slightly shorter than Group B’s.
4. Which group has the greater variability in the bottom 50% of shopping times ? The top 50% of shopping times ? Explain how you know.
Group A; Group B; look at which box plot has a greater distance from the median to the minimum or maximum value, respectively.
Subscribe to our ▶️ YouTube channel 🔴 for the latest videos, updates, and tips.
Kindly mail your feedback to v4formath@gmail.com
We always appreciate your feedback.
About Us | Contact Us | Privacy Policy
©All rights reserved. onlinemath4all.com

Recent Articles
-
Digital SAT Math Questions and Answers (Part - 13)
May 17, 26 09:03 AM
 Digital SAT Math Questions and Answers (Part - 13)
 -
Problems on Solving Logarithmic Equations
Apr 24, 26 09:30 PM
Problems on Solving Logarithmic Equations -
Solving Logarithmic Equations Worksheet
Apr 24, 26 09:05 PM
 Solving Logarithmic Equations Worksheet