STATISTICS
Subscribe to our ▶️ YouTube channel 🔴 for the latest videos, updates, and tips.
Definition of Statistics :
We may define statistics either in a singular sense or in a plural sense Statistics, when used as a plural noun, may be defined as data qualitative as well as quantitative, that are collected, usually with a view of having statistical analysis.
However, statistics, when used as a singular noun, may be defined, as the scientific method that is employed for collecting, analyzing and presenting data, leading finally to drawing statistical inferences about some important characteristics it means it is ‘science of counting’ or ‘science of averages’.
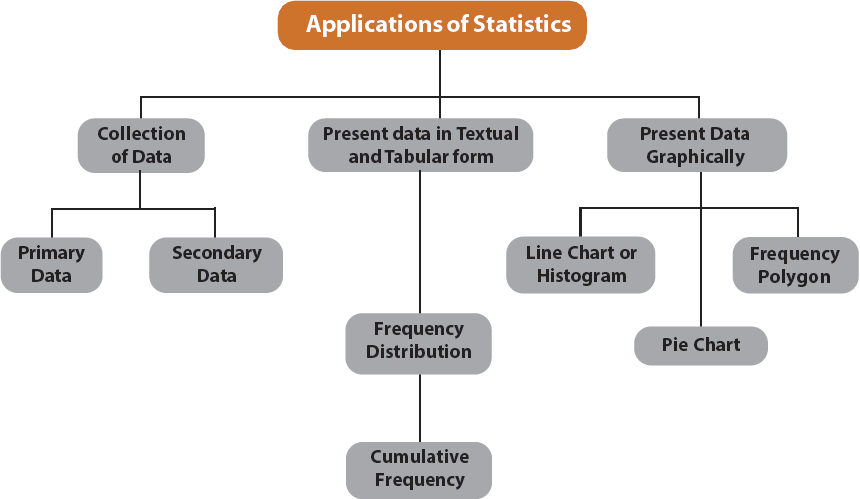
Application of Statistics
Among various applications of statistics, let us confine our discussions to the fields of Economics, Business Management and Commerce and Industry.
Limitations of Statistics :
Before applying statistical methods, we must be aware of the following limitations :
1. Statistics deals with the aggregates. An individual, to a statistician has no significance except the fact that it is a part of the aggregate.
2. Statistics is concerned with quantitative data. However, qualitative data also can be converted to quantitative data by providing a numerical description to the corresponding qualitative data.
3. Future projections of sales, production, price and quantity etc. are possible under a specific set of conditions. If any of these conditions is violated, projections are likely to be inaccurate.
4. The theory of statistical inferences is built upon random sampling. If the rules for random sampling are not strictly adhered to, the conclusion drawn on the basis of these unrepresentative samples would be erroneous. In other words, the experts should be consulted before deciding the sampling scheme.
Collection of Data
We can broadly classify data as
(a) Primary
(b) Secondary
Collection of data plays the very important role for any statistical analysis. The data which are collected for the first time by an investigator or agency are known as primary data whereas the data are known to be secondary if the data, as being already collected, are used by a different person or agency.
Collection of Primary Data :
The following methods are employed for the collection of primary data :
(i) Interview method
(ii) Mailed questionnaire method
(iii) Observation method
(iv) Questionnaires filled and sent by enumerators.
Sources of Secondary Data :
There are many sources of getting secondary data. Some important sources are listed below :
(a) International sources like WHO, ILO, IMF, World Bank etc.
(b) Government sources like Statistical Abstract by CSO, Indian Agricultural Statistics by the Ministry of Food and Agriculture and so on.
(c) Private and quasi-government sources like ISI, ICAR, NCERT etc.
(d) Unpublished sources of various research institutes, researchers etc.
Scrutiny of Data :
Since the statistical analyses are made only on the basis of data, it is necessary to check whether the data under consideration are accurate as well as consistence. No hard and fast rules can be recommended for the scrutiny of data. One must apply his intelligence, patience and experience while scrutinizing the given information.
Errors in data may creep in while writing or copying the answer on the part of the enumerator. A keen observer can easily detect that type of error. Again, there may be two or more series of figures which are in some way or other related to each other. If the data for all the series are provided, they may be checked for internal consistency.
A good statistician can also detect whether the returns submitted by some enumerators are exactly of the same type thereby implying the lack of seriousness on the part of the enumerators. The bias of the enumerator also may be reflected by the returns submitted by him. This type of error can be rectified by asking the enumerator(s) to collect the data for the disputed cases once again.
Presentation of Data
Once the data are collected and verified for their homogeneity and consistency, we need to present them in a neat and condensed form highlighting the essential features of the data. Any statistical analysis is dependent on a proper presentation of the data under consideration.
Classification or Organization of Data :
It may be defined as the process of arranging data on the basis of the characteristic under consideration into a number of groups or classes according to the similarities of the observations.
Following are the objectives of classification of data:
(a) It puts the data in a neat, precise and condensed form so that it is easily understood and interpreted.
(b) It makes comparison possible between various characteristics, if necessary, and thereby finding the association or the lack of it between them.
(c) Statistical analysis is possible only for the classified data.
(d) It eliminates unnecessary details and makes data more readily understandable.
Data may be classified as -
(i) Chronological or Temporal or Time Series Data;
(ii) Geographical or Spatial Series Data;
(iii) Qualitative or Ordinal Data;
(iv) Quantitative or Cardinal Data.
Data classified in respect of an attribute are referred to as qualitative data. Data on nationality, gender, smoking habit of a group of individuals are examples of qualitative data. Lastly, when the data are classified in respect of a variable, say height, weight, profits, salaries etc., they are known as quantitative data.
Data may be further classified as frequency data and non-frequency data. The qualitative as well as quantitative data belong to the frequency group whereas time series data and geographical data belong to the non-frequency group.
Mode of Presentation of Data :
Next, we consider the following mode of presentation of data:
(a) Textual presentation;
(b) Tabular presentation or Tabulation;
(c) Diagrammatic representation.

Apart from the stuff given above, if you need any other stuff in math, please use our google custom search here.
Subscribe to our ▶️ YouTube channel 🔴 for the latest videos, updates, and tips.
Kindly mail your feedback to v4formath@gmail.com
We always appreciate your feedback.
About Us | Contact Us | Privacy Policy
©All rights reserved. onlinemath4all.com
Recent Articles
-
Specifying Units of Measure
Dec 15, 25 07:09 PM
Specifying Units of Measure -
Quantitative Reasoning Questions and Answers
Dec 14, 25 06:42 AM
Quantitative Reasoning Questions and Answers -
Coin Tossing Probability
Dec 13, 25 10:11 AM
Coin Tossing Probability - Concept - Sample Space - Formula - Solved Problems