SCATTER DIAGRAM
This is a simple diagrammatic method to establish correlation between a pair of variables.
Unlike product moment correlation co-efficient, which can measure correlation only when the variables are having a linear relationship, scatter-diagram can be applied for any type of correlation – linear as well as non-linear i.e. curvilinear.
Scatter-diagram can distinguish between different types of correlation although it fails to measure the extent of relationship between the variables.
Each data point, which in this case a pair of values (xi, yi) is represented by a point in the rectangular axes of coordinates. The totality of all the plotted points forms the scatter diagram.
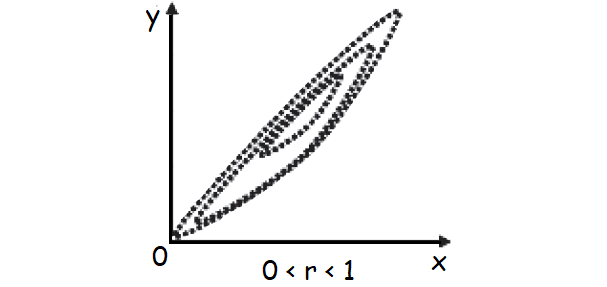
The pattern of the plotted points reveals the nature of correlation.
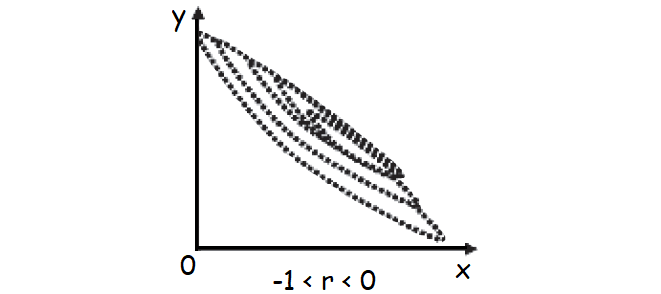
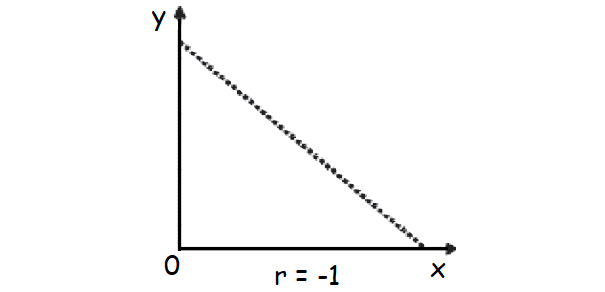
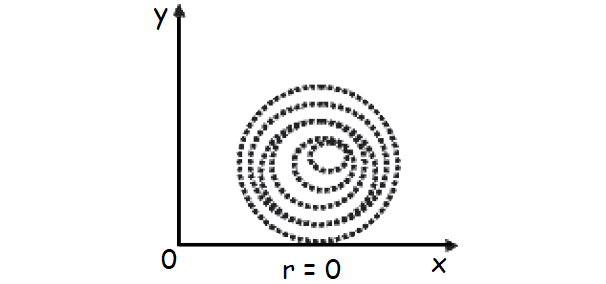
In case of a positive correlation, the plotted points lie from lower left corner to upper right corner, in case of a negative correlation the plotted points concentrate from upper left to lower right and in case of zero correlation, the plotted points would be equally distributed without depicting any particular pattern.
The coefficient of correlation r always lies between –1 and 1, including both the limiting values.
-1 ≤ r ≤ 1
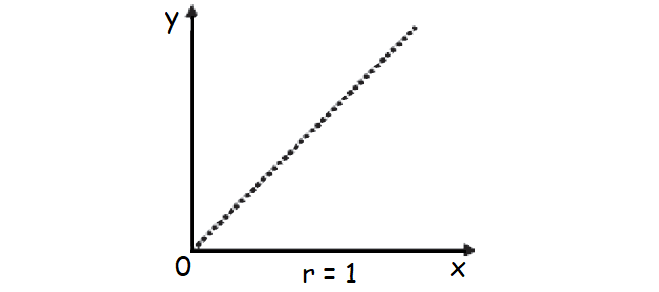
The following figures show different types of correlation and the one to one correspondence between scatter diagram and product moment correlation coefficient.
Positive Correlation
Perfect Positive Correlation
Negative Correlation
Perfect Negative Correlation
No Correlation
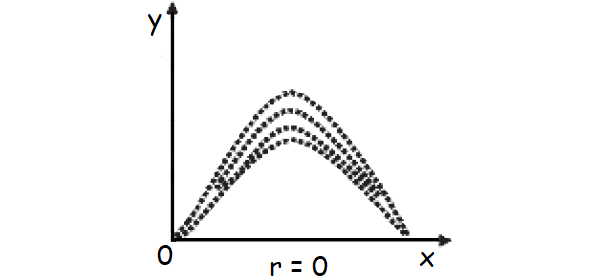
Curvilinear Correlation
Importance of Scatter Diagram
The best measure of correlation is provided by Pearson’s correlation coefficient.
However, one severe limitation of this correlation coefficient, as we have already discussed, is that it is applicable only in case of a linear relationship between the two variables.
If two variables x and y are independent or uncorrelated then obviously the correlation coefficient between x and y is zero.
However, the converse of this statement is not necessarily true i.e. if the correlation coefficient, due to Pearson, between two variables comes out to be zero, then we cannot conclude that the two variables are independent.
All that we can conclude is that no linear relationship exists between the two variables. This, however, does not rule out the existence of some non linear relationship between the two variables.
For example, if we consider the following pairs of values on two variables x and y.
(–2, 4), (–1, 1), (0, 0), (1, 1) and (2, 4)
Cov(x, y) = (–2 x 4) + (–1 x 1) + (0 x 0) + (1 x 1) + (2 x 4)
= 0
as arithmetic mean of x = 0.
Thus, r = 0.
This does not mean that x and y are independent. In fact the relationship between x and y is y = x2.
Thus it is always wiser to draw a scatter-diagram before reaching conclusion about the existence of correlation between a pair of variables.
Kindly mail your feedback to v4formath@gmail.com
We always appreciate your feedback.
©All rights reserved. onlinemath4all.com
Recent Articles
-
De Moivre's Theorem and Its Applications
Apr 19, 24 08:30 AM
De Moivre's Theorem and Its Applications -
First Fundamental Theorem of Calculus - Part 1
Apr 17, 24 11:27 PM
First Fundamental Theorem of Calculus - Part 1 -
Polar Form of a Complex Number
Apr 16, 24 09:28 AM
 Polar Form of a Complex Number