GREATEST INTEGER FUNCTION
The greatest integer function is denoted by
y = [x]
For all real values of x, the greatest integer function returns the greatest integer which is less than or equal to x.
In essence, it rounds down to the the nearest integer.
[3] = 3
[3.2] = 3
[3.9] = 3
[-2] = -2
[-2.8] = -3
Value of y = [x]
In the greatest integer function, [x], if x is integer, what should we do ?
In [x], if x is integer, then the value of [x] is also the same value of x.
[1] = 1
[4] = 4
[-2] = -2
[-7] = -7
[128] = 128
[-225] = -225
In the greatest integer function, [x], if x is non integer (decimal), What should we do ?
In [x], if x is non integer(decimal), then the value of [x] is the largest integer less than or equal to the given decimal.
To understand of this, let us do this with number line.
Example 1 :
[1.6] = ?
To have value of [1.6], we have to mark 1.6 on the number line as shown below.
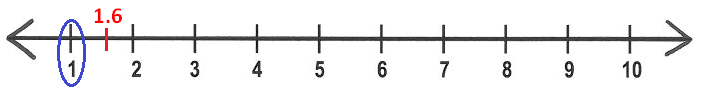
Pick the nearest integer on the left side of 1.6.
That is 1.
[1.6] = 1
Example 2 :
[4.5] = ?
To have value of [4.5], we have to mark 4.5 on the number line as shown below.
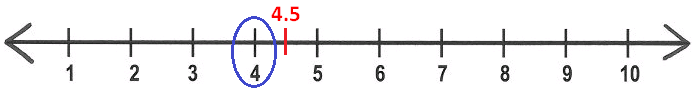
Pick the nearest integer on the left side of 4.5.
That is 4.
[4.5] = 4
Example 3 :
[5.6] = ?
To have value of [5.6], we have to mark 5.6 on the number line as shown below.
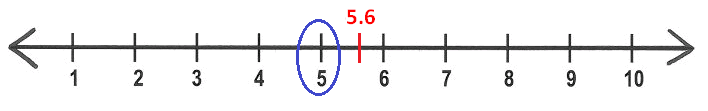
Pick the nearest integer on the left side of 5.6.
That is 5.
[5.6] = 5
Example 4 :
[-2.3] = ?
To have value of [-2.3], we have to mark -2.3 on the number line as show below below.
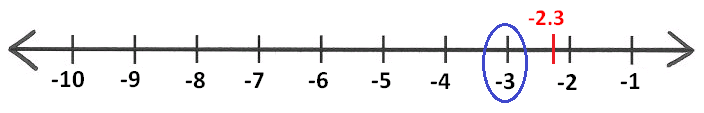
Pick the nearest integer on the left side of -2.3.
That is -3.
[-2.3] = -3
Example 5 :
[-5.6] = ?
To have value of [-5.6], we have to mark -5.6 on the number line as shown below.
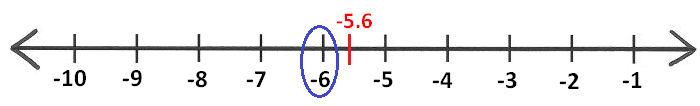
Pick the nearest integer on the left side of -5.6.
That is -6.
[-5.6] = -6
Example 6 :
[-7.8] = ?
To have value of [-7.8], we have to mark -7.8 on the number line as shown below.
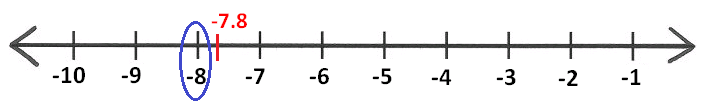
Pick the nearest integer on the left side of -7.8.
That is -8.
[-7.8] = -8
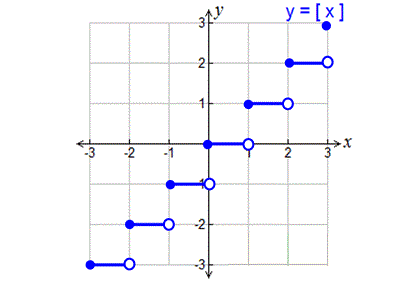
Graphing Greatest Integer Function
To graph the greatest integer function
y = [x],
we have to substitute some random values for x.
Substitute x = -3, -2, -1, 0, 1, 2, 3.
y = [-3] = -3 ----> (-3, -3)
y = [-2] = -2 ----> (-2, -2)
y = [-1] = -1 ----> (-1, -1)
y = [0] = 0 ----> (0, 0)
y = [1] = 1 ----> (1, 1)
y = [2] = 2 ----> (2, 2)
y = [3] = 3 ----> (3, 3)
How to plot the above points on the graph ?
Let us take the point (-3, -3).
Mark the point on xy- plane with a filled circle at (-3, -3).
Then extend a line for 1 unit on the left side of (-3,-3) and end up with empty circle.
Do the same thing for the other points too.
Now you will have a graph as shown below.
Kindly mail your feedback to v4formath@gmail.com
We always appreciate your feedback.
©All rights reserved. onlinemath4all.com
Recent Articles
-
First Fundamental Theorem of Calculus - Part 1
Apr 17, 24 11:27 PM
First Fundamental Theorem of Calculus - Part 1 -
Polar Form of a Complex Number
Apr 16, 24 09:28 AM
 Polar Form of a Complex Number
 -
Conjugate of a Complex Number
Apr 15, 24 11:17 PM
 Conjugate of a Complex Number