CONTRASTING LINEAR AND NONLINEAR DATA
Bivariate data is a set of data that is made up of two paired variables.
If the relationship between the variables is linear, then the rate of change (slope) is constant.
If the graph shows a nonlinear relationship, then the rate of change varies between pairs of points.
Example :
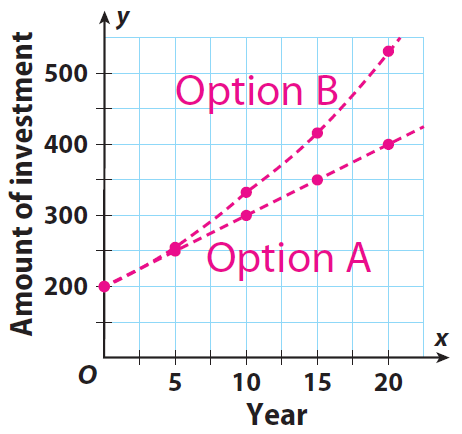
Andrew has two options in which to invest $200. Option A earns simple interest of 5%, while Option B earns interest of 5% compounded annually. The data given below shows the amount of the investment for both options over 20 years. Graph the data and describe the differences between the two graphs.
Year
(x)
0
5
10
15
20
Option A
Total ($)
200.00
250.00
300.00
350.00
400.00
Option B
Total ($)
200.00
255.26
325.78
415.79
530.66
Solution :
Step 1 :
Graph the data from the table for Options A and B on the same coordinate grid.
Step 2 :
Find the rate of change between pairs of points for Option A and classify the relationship.
Use the formula given below for rate of change.
m = change in y values / change in x values
(0, 200) and (5, 250) :
m = (250 - 200) / (5 - 0) = 10
(5, 250) and (10, 300) :
m = (300 - 250) / (10 - 5) = 10
(10, 300) and (15, 350) :
m = (350 - 300) / (15 - 10) = 10
The rate of change between the data values is constant. So the graph of option A shows a linear relationship.
Step 3 :
Find the rate of change between pairs of points for Option B and classify the relationship.
(0, 200) and (5, 255.26) :
m = (255.26 - 200) / (5 - 0) ≈ 11.
(5, 255.26) and (10, 325.78) :
m = (325.78 - 255.26) / (10 - 5) ≈ 14
(10, 325.78) and (15, 415.79) :
m = (415.79 - 325.78) / (15 - 10) ≈ 18
The rate of change between the data values is not constant. So the graph of option B shows a nonlinear relationship.
Reflect
1. Why are the graphs drawn as lines or curves and not discrete points ?
We can calculate the value of the account at any time as the money grows. All points along the line or curve are reasonable and possible.
2. Can we determine by viewing the graph if the data have a linear or nonlinear relationship ? Explain.
Yes. If all of the data lie on a line, then the data have a linear relationship. If the graph is a curve (or not a line), then the data have a nonlinear relationship.
3. Find the differences in the account balances to the nearest dollar at 5 year intervals for Option B. How does the length of time that money is in an account affect the advantage that compound interest has over simple interest ?
$55, $71, $90, $115; the longer that the money is in the account, the greater the relative advantage of it earning compound interest will be.

Apart from the stuff given above, if you need any other stuff in math, please use our google custom search here.
Kindly mail your feedback to v4formath@gmail.com
We always appreciate your feedback.
©All rights reserved. onlinemath4all.com
Recent Articles
-
Multi Step Algebra Word Problems
Apr 23, 24 09:10 PM
Multi Step Algebra Word Problems -
Solving Multi Step Word Problems Worksheet
Apr 23, 24 12:32 PM
 Solving Multi Step Word Problems Worksheet
 -
Solving Multi Step Word Problems
Apr 23, 24 12:07 PM
Solving Multi Step Word Problems
